
Washington State
Circular Resilience
Systemic Risk, Resilience, and Circular Economy Networks
Mapping Series
—
Prepared for: Washington Department of Ecology, King County Solid Waste
Presented by: NextCycle Washington (NCWA), Start Consulting, Equity Analytics Group, Traversal Design, and kamal designs. Special thanks to RRS, and Cascadia Consulting for support on this project.
—
Overview: The intent of this research and resulting map series is to illuminate the relationships between community-focused circular economies (e.g., community reuse, repair, share, compost) and the compounding threats to community resilience facing Washington State. Building on the Washington Department of Health’s, Environmental Health Disparities Map, we show where funding, investment, and technical assistance are being directed and where it is needed.
The Environmental Risk and Threats to Resilience (ERTR) Map: The aim of this map is to provide a tool for understanding funding and technical assistance needs, gaps, and opportunities to strengthen networks of circular economy and community resilience in Washington State. While in no way complete, our hope is that this version (1.0) will be the first in a series.
Viewing the maps:
Darker shades show census tracts that are more at risk of environmental threats and have more threats to community resilience than other census tracts in Washington.
Overlayed dots highlight active and existing community-focused circular resilience initiatives
Acknowledgments: The research presented here builds on NCWA co-design priorities and tactics, and the People’s Economy Lab’s just transition mapping sessions.
(See more acknowledgments at the conclusion of this website)
This map series is an alpha release.
How to interact with these maps
Reload the webpage if your map isn’t responding.
Adjusting Map Sliders
Adjust the sliders below the map to view circular resilience initiatives with different risk & resilience scores within the census tracts.
Using Checkboxes
Check or uncheck the boxes below the map to view circular resilience initiatives by particular elements.
Hovering & Clicking
Hover over each census tract or circular resilience initiative to see more details. Clicking on any element of the map will select only that element. To de-select and see everything again, click on the same element again.
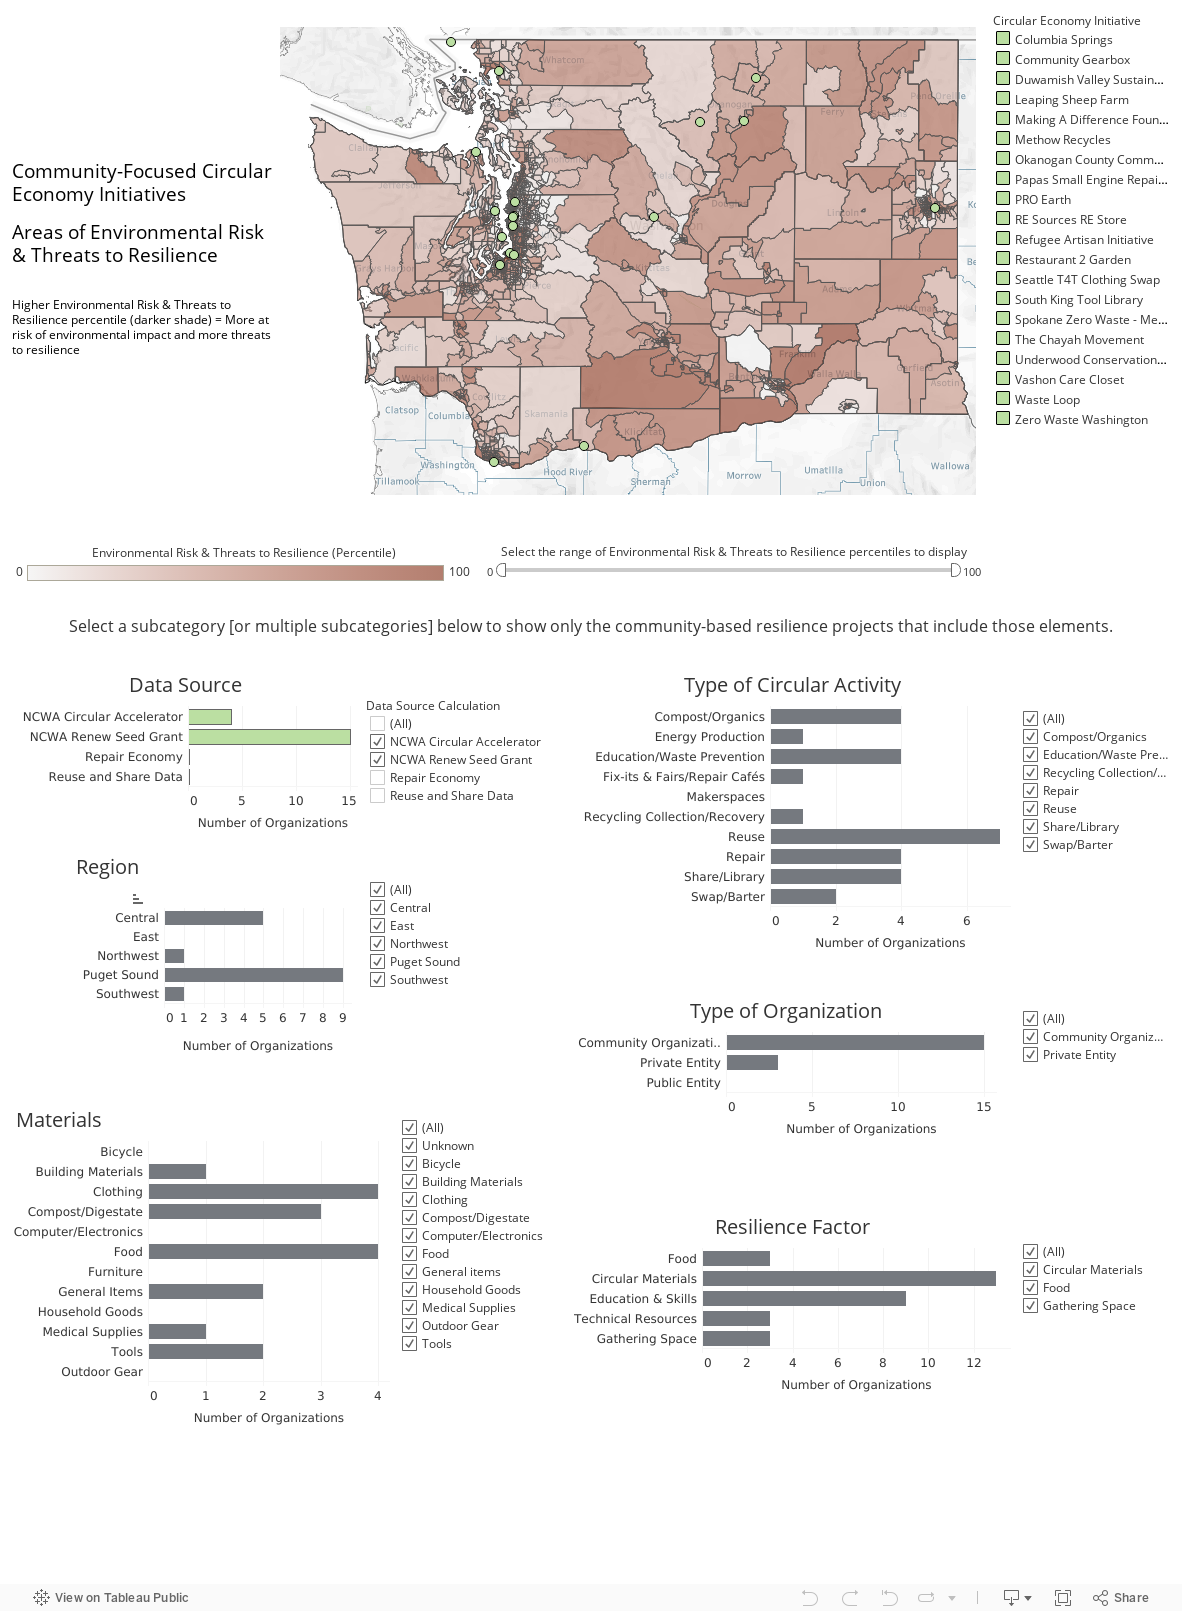
What this map tells us.
This map demonstrates areas with both high levels of environmental risk and threats to resilience across the state, in urban, suburban, and rural areas, in each geographic region, and in every county. It also shows which community-focused circular initiatives and networks are operating in areas with high risk of environmental impacts and threats to resilience.
Why this is important.
This research is important to communicate the intersection of circular economy and community resilience initiatives. This work can elevate and strengthen this connection by:
Highlighting where funding and technical support is being directed towards circular resilience initiatives and networks.
Helping visualize alternative material-based circular economies as “work already being done”, by and for Washington communities.
Building on existing publicly available data (e.g., Census data, Health Disparities Map, FEMA) to understand systemic risk and threats to resilience.
Showing the context in which community-focused circular resilience initiatives operate and their specific environmental risks and threats to resilience.
Elevating opportunities for:
Resilience hub development connected to the circular economy.
Gathering data to bridge existing gaps.
Assisting community-focused organizations in communicating the need for support (e.g., funding and technical support).
Who is on the map.
To be shown on the maps presented here, an organization or project must be:
Aiding community-focused circular materials, focused on building resilience through circular economies in their own community,
Focusing on essential items and services, and
Doing this work NOW, not just demonstrating potential to do so in the future.
Note: The initiatives shown on this map do not represent a complete list of circular economy initiatives present in Washington State.
What we mean by:
Circular Economy
The circular economy is based on three principles, driven by design (Ellen MacArthur Foundation):
• Eliminate waste and pollution
• Circulate products and materials (at their highest value)
• Regenerate nature
Community resilience:
Community resilience is the sustained ability of a community to use available resources (energy, communication, transportation, food, etc.) to respond to, withstand, and recover from adverse situations (e.g., economic collapse to global catastrophic risks). (Wikipedia)
Circular resilience initiative
A circular resilience initiative is the intersection of a community-driven circular economy initiative that strengthens community resilience.
How is the Risk & Threats to Resilience map generated?
The Environmental Risk and Threats to Resilience (ERTR) Map shows a compounding relationship between the risk a community is exposed to and their ability to be resilient in response to those stressors. The ERTR Map used two publicly available maps to create a new map. The two map indexes used were the FEMA Community Resilience Challenge Index and the Washington Department of Health Environmental Health Disparities Map score.
This new map relies on the following calculation for each census tract as:
(FEMA Community Resilience Challenge Index) x (Washington Environmental Health Disparities Risk Score) /10
This new index is presented as a choropleth map with census tracts shaded to indicate their percentile rank. The result compares each census tract to all other tracts in Washington State.
For example, if a census tract has a percentile rank of 70, this indicates that 70% of all census tracts in Washington State have a lower Risk & Resilience Factor.
Community-focused circular economy initiatives were identified from publicly-available data. Those efforts were then plotted on the ERTR Map. The result identifies efforts were located in areas that had a confluence of both high risk of environmental impacts (DOH Map) and significant threats to resilience in response to stressors (FEMA Map).

Threats to Resilience
This map by FEMA shows economic, health, & social factors that are likely to compromise ability of community to recover from stressors (acute & chronic).
—
This map is built using data from the FEMA Community Resilience Challenges Index which uses 22 indicators to calculate a measure of the relative potential resilience across the country. The data is then displayed as the percentile rank (0 to 100) for each census tract in relation to the others in the set (Washington State), where a higher rank (shown on the map above as a darker shade) indicates more challenges to resilience.
X

Environmental Risks
This Washington Department of Health (DOH), Environmental Health Disparities map shows environmental risks (pollution burden, exposure to toxins, other environmental hazards) and the location of sensitive & vulnerable populations.
—
This map is built using data from the Washington Environmental Health Disparities Map, a tool developed by the Washington State Department of Health. It uses a variety of publicly available data and calculates a single score intended to show the risk each community in Washington faces from socioeconomic and environmental factors.
Using the variables listed below and the methods described here,, each census tract in Washington was assigned a score between 1 and 10, where 10 (shown on the map above as a darker shade) indicates more risk.
=

Environmental Risk & Threats to Resilience
This Environmental Risk and Threats to Resilience (ERTR) map shows where there are areas of both high levels of environmental risk and threats to resilience.
—
This new map shows systemic relationships between economic, health and social factors in the FEMA map with pollution burden, exposures to toxins, and socio-economic factors in the Health Disparities map.
Feedback so far.
“This is validating. "Look we need this". It validates funding principles.”
-
“Foundations and agencies are trying to fund in underserved projects. Now you can see initiatives being rolled out.”
-
“This is really useful for state, county and city policy and program development!”
-
“It's useful to see where [circular resilience] initiatives are not present.”
Data variables used in each map.

Sources: Blue map: FEMA Community Resilience Challenges Index
Purple map: Washington Environmental Health Disparities Map.
—-
In the table at right, an “x” shows that the variable is used in the calculation of each index. For the Environmental Risk & Threats to Resilience index, an “x2” indicates that the variable is used in both of the source indexes (although not necessarily with equal weight - please see the methods for each source index for more information about weighting and index calculations.)
Census Tracts
Because the FEMA resilience data used 2022 census tracts and the Washington Environmental Health Disparities data used 2019 census tracts, Environmental Risk & Threats to Resilience Factors were only directly calculable for census tracts that were consistent between the two datasets. Where census tracts were aggregated or divided, census tracts from 2019 were matched to 2022 census tracts using the US Census 2010 to 2020 relationship files and performing a best fit on total census tract area.
Mapping
The maps on this page were generated using Tableau Public using census tract data as crosswalks between data sets. Latitude and longitude were determined using Geocod.io. When specific locations were not applicable, or when inappropriate for privacy reasons, nearby locations were assigned within the same census tract.
Limitations of this map.
Environmental Risk and Threats to Community Resilience Data
Risk and threat scores were only calculable for census tracts that were consistent among source datasets. This may result in data from nearby areas influencing the scores assigned to those tracts.
Census tract data are more accurate and granular than other geographic units, like counties. However, census track data still poses challenges of over-aggregation. This occurs when the risks and threats to the communities within a tract vary significantly.
The source data from the Health Disparities and FEMA maps were developed with other uses in mind. The combination of these data sets are relevant to community resilience. However, there may be unintended consequences in the use of the underlying data.
Community-Focused Circular Economy Initiative Data Limitations
Data for the location, type, and nature of each Initiative (yellow and green dots on the maps) were collected from a variety of sources, including Repair Economy Washington, NextCycle Washington, and desktop research conducted by our team, and as such will require verification and updates with each iteration.
We acknowledge that this is not a complete representation of community-focused circular economy initiatives, projects, and organizations. This data set and maps are an initial attempt to visually show circular economy. The long term goal is to refine and expand on this initial data.
We note particular gaps in the representation of initiatives located within lands of Indigenous communities. Future iterations of this map would be greatly improved by indigenous community participation.
How is it different than other maps?
While existing resources identify areas of risk, areas of resilience, and components of community-based circular initiatives separately, the results of our research present this information in a new way. Highlighting the connection between the circular economy and resilience and feedback from community members demonstrated that this provided a relevant and needed tool to promote community resilience.
An example of how the Environmental Risk and Threats to Resilience map (ERTR) can be used is in clarifying the different impacts of investment in the circular economy and other resilience-strengthening efforts in areas with high percentile scores compared to those with low scores. In this way, the percentile scores can be considered a multiplier for the impact of investment and effort.
The Environmental Risk & Threats to Resilience map shows which community-focused circular economy initiatives are already present in areas with high levels of risk to environmental impact and threats to resilience. It also shows areas of need for community-focused circular resilience initiatives.
Defining map categories.
To be included on this map, organizations had to provide at least one Resilience Factor, include Circular Materials that are connected to building community resilience, and be a community-focused initiative.
Data Source
Resilient circular economy initiatives were identified through:
NextCycle Washington. Community-focused/led Circular Accelerator and Renew Seed Grant participants
Repair Economy WA. Community-based/led repair and circular economy-related makerspace initiatives
Reuse and share research. Limited research is available that lists reuse and share initiative throughout the Washington. Research was conducted by Start Consulting Group to include community-led/based reuse and share programs related to resilience throughout Washington. Additional research is needed to create a more comprehensive list.
Regions
Geographic regions were selected to align with those used by the Washington State Department of Ecology.
Type of Organization
Circular Economy initiatives were grouped by organization type:
Community Organization. Nonprofit organizations that are led and driven by local community.
Private Entity. Businesses that provided accessible services and skill training that support the local circular economy and resilience.
Public Entity. Government programs that support the circular economy and resilience such as libraries of things and fix-it fair events and also serve as gathering spaces for community.
Type of Circular Economy Activity
Circular Economy Activity categories were defined as:
Reuse. Activities that keep useable and reusable materials in circulation in local communities. The materials reuse had to focus on materials (see Circular Materials Connected to Community Resilience section for list) that would support strengthening community resilience and supporting resilience in times of emergency.
Repair. Activities that support repair services or educate people to repair and build community resilience.
Share/Library. Activities that connect community and build resilience by creating no cost access to borrow and share tools, kitchen items, general goods, and more.
Compost/Organics. Activities that support organics collection and composting as a tool to build local resilience by operating locally and support community gardens in nutrient-rich food production.
Energy Production. Activities that produce circular energy by utilizing food and organic waste to be turned into energy through small-scale biodigesters.
Swap/Barter. Community-driven activities that support the trade of reused items with no monetary exchange.
Education/Waste Prevention. Activities that prevent waste and support the circular economy education programs that can also support community resilience.
Fix-it Fairs/Repair Cafes. Similar to the repair activity, these activities create gathering spaces and intergenerational community building and resilience through repairing items and teaching repair skills.
Makerspaces. Gathering spaces that have ties to circular materials and allow community members to create and build items at no to low cost.
Recycling Collection/Recovery. A couple of community-led/driven initiatives include recycling collections and recovery, however, there is no strong tie to building local resilience since most materials collected are sent out of the region and recycled locally. The organizations that collect recyclable materials also have reuse and repair initiatives. Further study is needed to make the correlation of recycling/recovery to resilience efforts.
Resilience Factor
The following Resilience Factors that tied to the Circular Economy were used as criteria in selecting initiatives to include in this study:
Circular Materials. Materials available to community through reuse, repair, share, and organics that support local resilience.
Education and Skills. Educational programs and skill building that support resilience and the circular economy.
Food. Initiatives that rescue or glean food for community members and educate community members on food waste prevention to conserve resources.
Gathering Space. Safe spaces for community members to strengthen resilience through building community through the use of circular materials.
Technical Resources. Initiatives that use technical expertise to build community resilience through support in circular initiatives.
Circular Economy Materials
The following Circular Economy Materials were identified for their role in promoting Community Resilience:
Bicycles
Building Materials
Clothing
Compost/Digestate
Computer/Electronics
Digestate
Food
Furniture
General Items
Household Goods
Medical Supplies
Tools
Outdoor Gear
Threats to Resilience Map (FEMA)
This blue map below shows economic, health, & social factors that are likely to compromise the ability of community to recover from stressors (both acute & chronic).
This map is built using data from the FEMA Community Resilience Challenges Index which utilizes 22 indicators (3 of which overlap with the Environmental Health Disparities Risk index) to calculate a measure of the relative potential resilience across the country. The data is then displayed as the percentile rank (0 to 100) for each census tract in relation to the others in the set (in our case, Washington State), where a higher rank (shown on the map above as a darker shade) indicates more challenges to resilience..
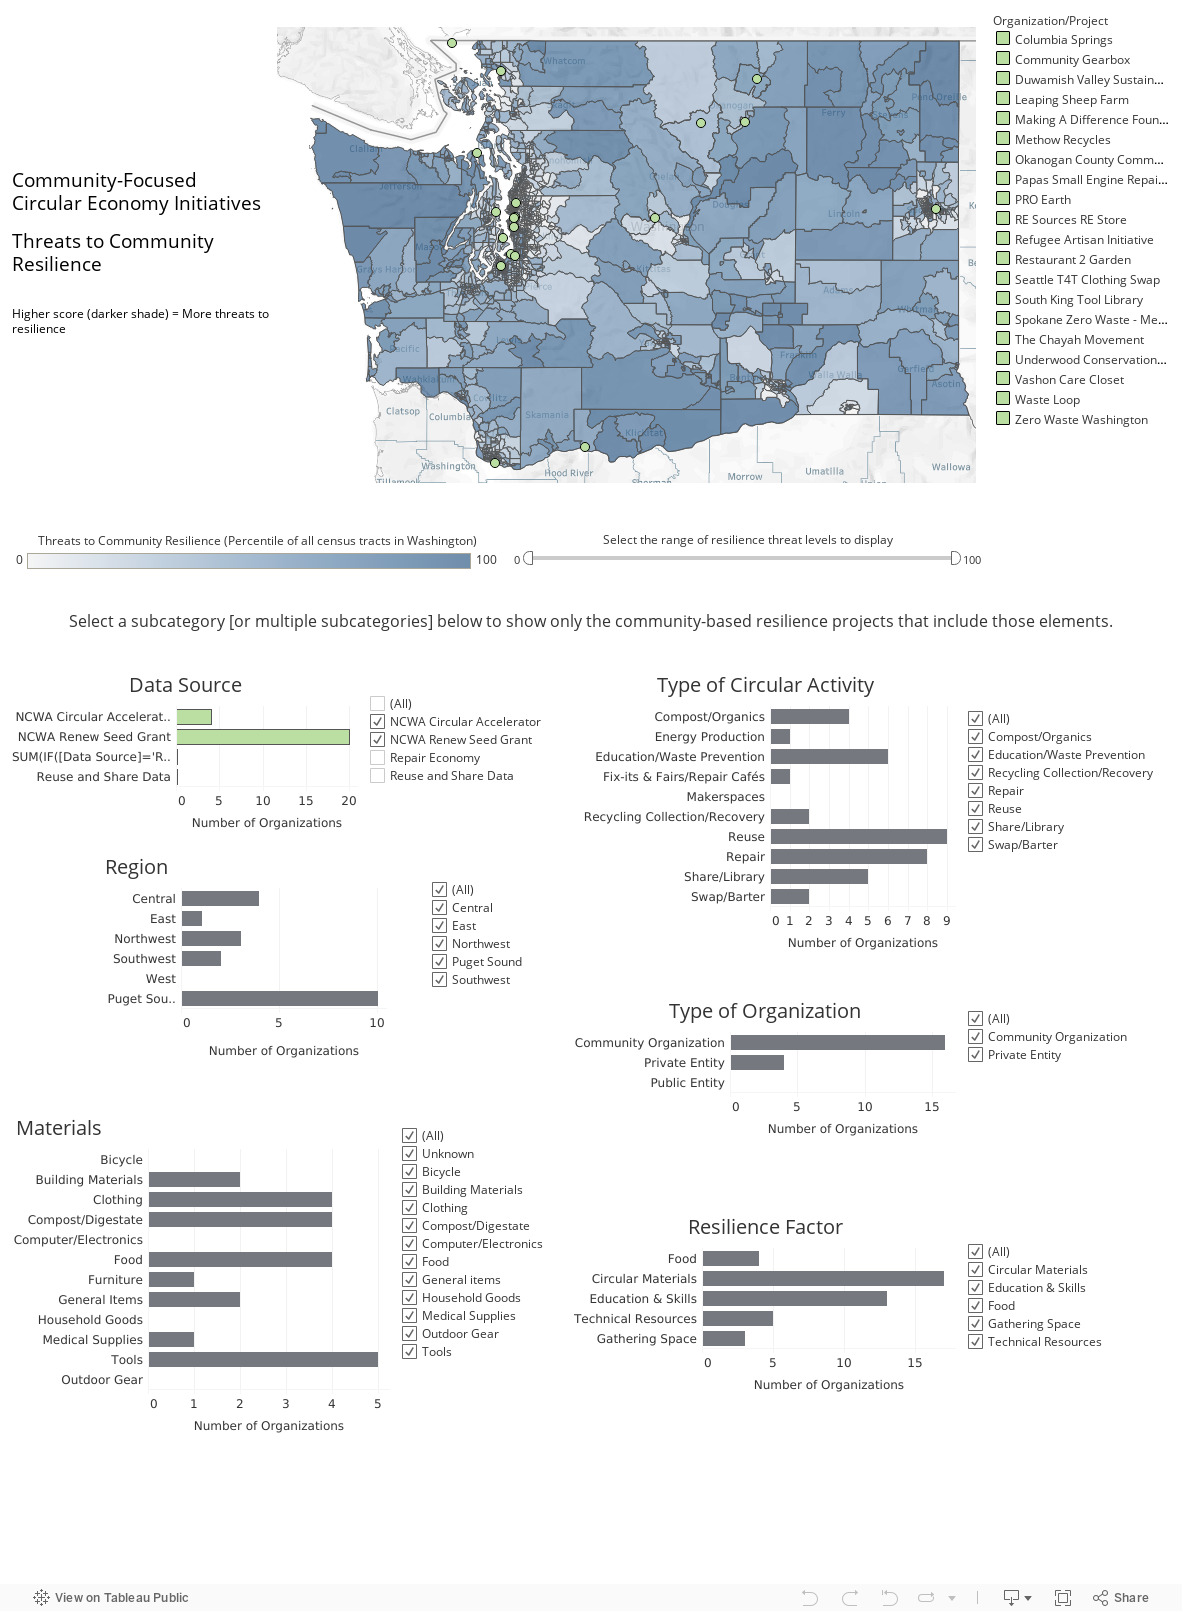
What this map tells us.
According to the analysis of risk factors performed by FEMA, there are areas with challenges to resilience across the state, in urban, suburban, and rural areas.
There are community-focused circularity initiatives in areas with challenges to resilience and in areas where those threats are lower.
When comparing this map to the Risks of Environmental Health Disparities (below), we see that while the environmental risks sometimes overlap with areas experiencing threats to resilience, they do not always coincide.
Risk of Environmental Effect Map
This purple map below shows environmental risks (pollution burden, exposure to toxins, other environmental hazards) and the location of sensitive & vulnerable populations.
This map is built using data from the Washington Environmental Health Disparities Map, a tool developed by the Washington State Department of Health. This map uses a variety of publicly available data to calculate a single score intended to show the risk each community in Washington faces from socioeconomic and environmental factors.
Using the variables listed at below and the methodologies described here, each census tract in Washington was assigned a score between 1 and 10, where 10 (shown on the map below as a darker shade) indicates more risk.

What do we mean by (Glossary):
Community-focused
Community-led and based organizations have filled gaps in the circular economy for decades where public and private groups have failed to provide investment. Significant investment has been made into solid waste, landfills, and recycling systems, however, systems for reuse, repair, share, and other circular economy projects have been primarily funded and operated by community. While there are significant investments being made by public and private organizations into large-scale compost and organics systems, these systems are not accessible to everyone and some community groups have stepped in to fill this gap.
Community resilience
Community resilience is the sustained ability of a community to use available resources (energy, communication, transportation, food, etc.) to respond to, withstand, and recover from adverse situations (e.g., economic collapse to global catastrophic risks). (Wikipedia)
Circular economy
The circular economy is based on three principles, driven by design (Ellen MacArthur Foundation):
Eliminate waste and pollution
Circulate products and materials (at their highest value)
Regenerate nature
Circular resilience initiative
A circular resilience initiative is the intersection of a community-driven circular economy initiative that strengthens community resilience.
Environmental risk
In this report we are using the term Environmental Risk to refer to the combined risk of a specific source or concentration of pollution in the environment and a person’s (or population’s) non-biological situation that affects their ability to cope with risk factors, as defined by the Washington State Department of Health.
Resilience hubs
Resilience Hubs are community-serving facilities augmented to support residents and coordinate resource distribution and services before, during, or after a natural hazard event. (Defined by Urban Sustainability Directors Network https://www.usdn.org/resilience-hubs.html)
Systemic risk
Risks to communities that are compounded by interacting systemic issues and exposures like environmental, social disadvantages, economic, and health risks.
Threats to resilience
Resilience is the ability to adapt to changing conditions and withstand and rapidly recover from disruption due to emergencies (as defined by the Federal Emergency Management Agency).
Findings and Initial community feedback
Theme 1: this is new
Existing resources separately identify areas of risk, areas of resilience, and components of community-based circular initiatives. The results of our research have allowed us to present this information in a new way, the ERTR Map. We highlighted the connection between the circular economy and resilience. We received feedback from community members that this provided a relevant and needed tool to promote community resilience.
Theme 2: this is useful
Community feedback demonstrated that this research can be used to target support for existing and burgeoning circular resilience initiatives. This could help strengthen community resilience as they navigate stressors. The ERTR map provides connections and networking opportunities with other granting and support systems for community-focused circular resilience initiative and network development.
Theme 3: This is relevant
Community feedback also indicated that the structure of this research affirmed an understanding that practitioners of both resilience efforts and circular economy initiatives had experienced: that the connection between preparing and repairing were deeply connected. The work to build communities' resilience was intertwined with the circular economy. For example, community members shared that:
Shared space around circular activities creates safe gathering spaces that will be critical for resilience
Through circular economy practices and emergency preparation, seemingly disparate community members find they have common interests and common ground, especially when language for circular economy and resilience needs are localized to each community (one community may call it taking care of myself, resilience, DIY mindset, etc.)
The development of relationships of respect and cross-generational skill sharing that occurs in circular economy efforts is critical (elders often have more facility with repair/share and youth are able to leverage facility with technology)
Next Steps:
Continue to add appropriate organizations and projects.
Look at funding gaps and opportunities.
Build more community engagement with regional partners (e.g eastern, central, puget sound), or with communities that have darker shades on the map, or have projects that need network development.
Invite community to identify additional circular resilience initiatives.
Special thanks to the participants of our group discussion helping us test and improve this map:
• Kami Bruner, Repair Economy
• Carol Lanigan, Green Okanogan
• Shiho Fuyuki, People’s Economy Lab
• Sarah Jo Lightner, Methow Recycles
• Joshua J Epstein, NE Seattle Tool Library
• Christoph Strouse, UW Sustainability Office
• Ashima Sukhdev, Seattle Public Utilities
• Chris Iberle, City of Seattle Office of Sustainability and Environment
Also special thanks to the folks who spent time with us in interviews and conversations to help us understand connections of systemic risk, resilience, and circular economy.